Voice Search and Local SEO: What “Near Me” Queries Actually Need
Voice Search and Local SEO: What “Near Me” Queries Actually Need Voice search local SEO is about making your business...
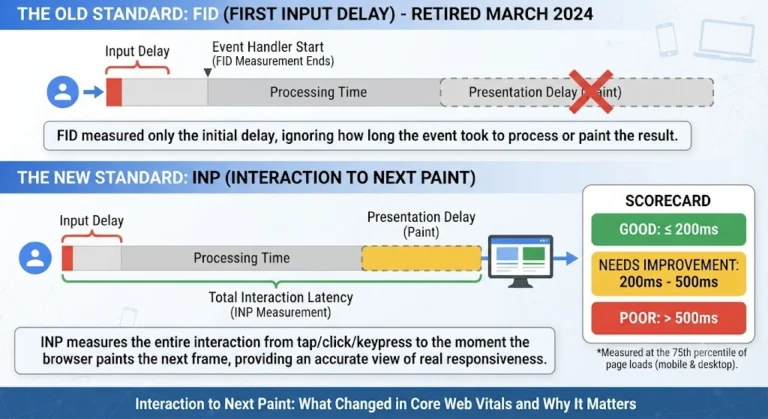
Read More → Interaction to Next Paint (INP) is now the metric that decides whether your site feels fast to real users — it measures the delay between a click, tap, or keypress and the moment the browser actually paints the next frame in response. Since March 2024, INP replaced First Input Delay (FID) as Google’s official Core Web Vitals responsiveness metric, and that shift changes how you should be auditing site performance in 2026.
FID only measured input delay — the gap before the browser even started processing your click. It ignored everything that happened after: how long the actual event handler took to run, or how long the browser needed to paint the result. A page could score a perfect FID and still feel sluggish every time someone tapped a button, because the real lag was happening after the click was registered, not before.
INP core web vitals scoring fixes that gap. It looks at the entire interaction — input delay, processing time, and presentation delay — and reports the slowest (or near-slowest) interaction across the full page visit, not just the first one. That’s a much closer match to what a user actually experiences when they’re scrolling, filtering, or filling out a form.
Lab data (from tools like Lighthouse) is generated by a script clicking through your page on a fixed device and network profile. It’s useful for catching regressions before you ship, but it can’t measure INP the way Google actually scores it, because INP by definition needs a real person interacting with a real page over a real session.
Field data — pulled from the Chrome User Experience Report (CrUX) and Real User Monitoring tools — is what shows up in Search Console and what actually feeds Google’s page experience signal. If your lab scores look great but your field INP is poor, the gap is almost always device diversity: real users are on mid-range Android phones, throttled networks, and background tabs eating CPU, none of which a lab test on a fast dev machine replicates well.
Google’s thresholds are straightforward:
These numbers are measured at the 75th percentile of page loads, across both mobile and desktop. So a handful of fast interactions won’t save you — it’s the typical worst-case experience that gets scored.
INP doesn’t replace the other Core Web Vitals — it sits alongside them, each covering a different part of page experience:
A page can nail LCP and CLS and still fail INP if JavaScript keeps the main thread busy every time someone interacts with it — heavy event listeners, large re-renders, or third-party scripts that hijack the thread are the usual culprits.
Core Web Vitals, INP included, are part of Google’s page experience signal — a real but comparatively minor factor next to content relevance and quality. It’s rarely going to push a weak page above a strong one, but among pages that are otherwise similar in relevance, a poor INP score can be the tiebreaker that costs you the position. More importantly, INP correlates directly with conversion and bounce rate — a laggy click-to-response experience loses users regardless of where you rank.
Most INP problems trace back to one of these:
This ties directly into how a search engine can even reach and re-evaluate your pages efficiently — if you haven’t already gone through our Core Web Vitals pillar guide, that’s the right next stop for the full technical SEO picture, and it’s worth reading alongside our crawl budget piece, since a bloated, slow-rendering site can quietly eat into how much of it gets crawled and indexed in the first place.
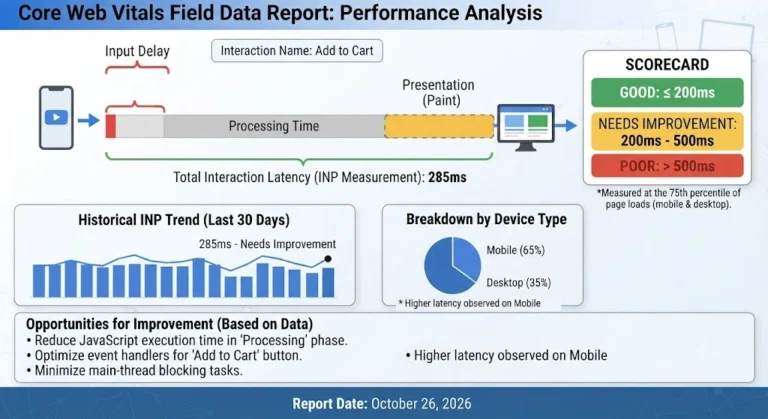
Under 200ms is considered good, 200–500ms needs improvement, and anything above 500ms is poor, measured at the 75th percentile of real user sessions.
Google made the switch official in March 2024, after INP had run as an experimental metric for about a year.
FID only measured the delay before an interaction started processing. INP measures the full interaction — delay, processing, and paint — giving a much more accurate picture of real responsiveness.
Lighthouse gives you a lab-based estimate, but true INP scoring depends on field data from real user sessions, so lab numbers alone won’t match what Search Console reports.
It’s one part of Google’s page experience signal — a minor ranking factor overall, but it can matter as a tiebreaker between otherwise similar pages, and it affects conversions regardless of ranking impact.
Long JavaScript tasks blocking the main thread, heavy event handlers, unoptimized third-party scripts, and large, frequently re-rendered DOM trees are the most common causes.
None of the three outranks the others — they measure different things (loading speed, visual stability, responsiveness) and all three need to pass for a page to be considered “good” overall.
Mobile devices generally show higher INP due to slower processors and network variability, which is why Google reports and thresholds account for both device types separately in field data.
Yes — ad networks, chat widgets, and heavy analytics tags are frequent main-thread hogs. Auditing and deferring non-critical scripts is often the fastest INP win available.
Check Search Console’s Core Web Vitals report monthly at minimum, and any time you ship a major frontend change, since a single heavy third-party script or unoptimized component can quietly tank the score.
INP is the clearest signal Google has ever given about what “responsive” actually means to a real user — not just how fast a click registers, but how fast the page visibly reacts to it. Chasing a perfect Lighthouse score without checking field data is the most common mistake here; fix that gap first, then work down the list of long tasks, heavy handlers, and third-party bloat. Do that consistently and INP stops being a Core Web Vitals worry and starts being a quiet, structural conversion advantage.
Got a confusion about site responsiveness, or want help improving your INP score? Call or WhatsApp us at 9718159724 — we’ll run a full technical audit, no obligation.